Working with MicroStock+Analytics
At a certain point, every stock contributor needs to analyze their portfolio to plan the next move. Which images are top performers? Which agencies bring the most value? M+ Analytics provides the data you need.
Содержание
What's M+Analytics
M+ Analytics is a companion service to M+ that allows you to track information about your portfolio's sales performance: the number of sales, profit in USD, and downloads. Its main feature is the sales graph, both overall and for individual stock agencies. For granular analysis, the platform allows you to organize files into custom "sets" (folders) for precise performance tracking.
The service aggregates real sales data directly from the agencies into a single dashboard, with the assurance that your information remains private.
This way, M+ Analytics allows you to evaluate your sales across all connected microstock agencies and helps define your strategic direction. Used alongside M+ Trends, it becomes a powerful tool for identifying profitable niches.
M+ Analytics uses the M+ database. All you need to get started is log in to your M+ account, navigate to the M+ Analytics (Free) page or purchase a subscription, and wait for the initial data to load (approximately within one hour). This article will introduce you to the service's interface, explain the sales graphs, and teach you how to create sets and populate them with your work.
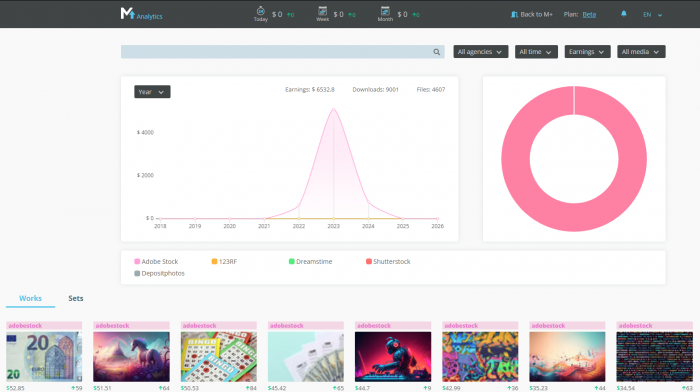
M+Analytics interface

For your convenience, let's break interface into three vertical sections:
- The top panel – contains your earnings counters and key service settings, such as language selection and notification preferences.
- The central area – your main analytical hub, featuring the sales graph, its control buttons, a search bar, a graph legend, and a pie chart.
- The bottom section – dedicated to the work gallery and sets.
Let's take a closer look at each of these areas.

Upper menu interface
М+ Analytics logo – clicking the M+ Analytics logo with the left mouse button directs you to the starting page
Profit counters – located to the right of the logo, these show your total profit for three periods: the last 24 hours (day), the last 7 days (week), and the calendar 30-day period (month). The number with an arrow indicates how your profit has changed compared to the previous period.
Return to M+ button – directs you to the M+ interface and closes the M+ Analytics service. To return again, select "Analytics" from the left-hand menu within the M+ interface.
Payment plan – this displays your current active M+ Analytics payment plan. Clicking on the payment plan name will redirect you to the store.
Bell icon – notifications about new sales and their settings. Hover your mouse cursor over the icon to adjust the frequency. Notifications can be turned on or off in your browser settings.
Language settings – the far-right icon. Currently, Russian and English are available.
2. The central area. Graphs and graph settings
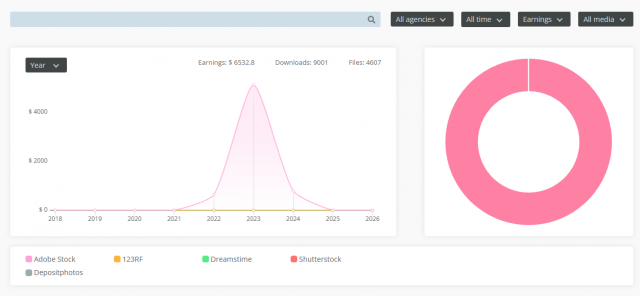
The central interface area

Search bar and filters
At the top of the center area, you'll find the search bar. Use it to locate files by name or description. Simply input your search query and press Enter or click the magnifying glass icon. The works in the lower part of the interface will be filtered, and the chart will adjust to reflect the selection.
Additional filters are located on the right:
- Agency selection – statistics for a specific microstock agency or for all microstock agencies combined.
- Period selection – displays data for the desired time range.
- When "Custom period" is selected, two buttons appear to the right of the dropdown menu showing the starting and ending periods. Click the calendar icon to change the values.
- Earnings/Downloads – sorts the works and displays the chart either by works total earnings or by the number of downloads.
- Content type – the last filter lets you filter works by type: raster images (photos and illustrations), vectors, or video files.
How to work with the graph
The graph shows how downloads or earnings change over time, based on the filters you've chosen. The X‑axis represents time, and the Y‑axis represents earnings or downloads.
At the top‑left graph corner, you can set the aggregation period: year, month, two weeks, etc. This controls which data is combined into each point on the graph line. In other words, the chart's granularity. This setting is automatically adjusted to match the time period you've selected in the filters.
Below the chart, you'll find color‑coded markers for each microstock agency. Clicking a marker toggles whether that agency is included in the graph and the pie chart. The list of works in the results remains unchanged, making it easy to compare performance. Hover your cursor over any graph point to view the exact earnings/download numbers for the selected microstock agency.
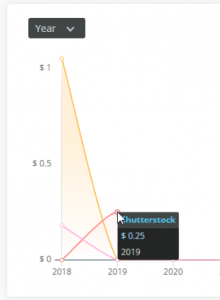
Graph point showing earnings

A pie chart
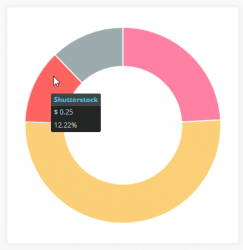
A pie chart and earnings for a specific microstock agency

A pie chart gives you a quick view of sales or downloads broken down by percentage. It automatically reflects the same filters you've set for the sales graph. The colors of the segments match the color‑coded markers for each microstock agency.
Simply hover your mouse cursor over a segment to see the exact number and its percentage share relative to the total of all selected microstock agencies.
3. Bottom section: Works gallery and sets
At the bottom of the interface, you'll find a gallery of all works ever uploaded to stocks through M+ that have had at least one sale from the moment they were first submitted. Each work appears as a preview card.
Gallery
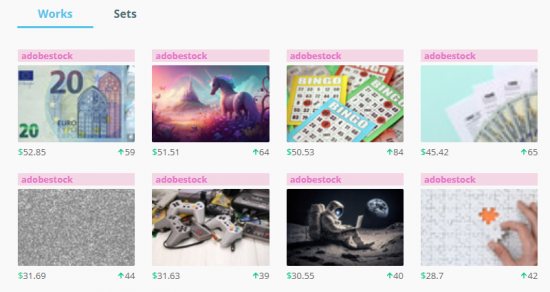
Gallery

Double‑click any card to open full statistics in a new browser tab. There you'll find a personal sales graph, its settings, a thumbnail, the title, content type, and links to the microstock agency pages where the work is being sold.
Each preview card gives you key information: which microstock agency the work is sold on, its total earnings on that microstock agency for the selected period, and how many downloads it had during that period.
Scroll down to load more works in the gallery.
Use the button at the bottom‑right corner to quickly jump back to the top of the page.
Hover your mouse cursor over any card, and you'll see an option to add it to a set. More on sets below.
Sets
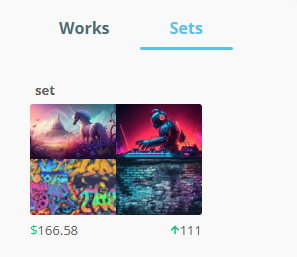
Set example

Sets help you organize your works into collections. They allow you to view statistics for each group separately. Think of them like of Pinterest boards or folders on your computer.
How to create a set:
- Hover your mouse cursor over any gallery card.
- Click the appeared menu.
- Select "+ New set", input a name, and press Enter.
How to enter a set:
- Go to the "Sets" tab (next to the "Works" tab).
- Double‑click any set
All works included in the set will be displayed as thumbnails. The sales graph and diagram will also show data for the selected set.
How to add a work to a set:
- Hover over a work and check the checkbox for the desired set. To remove a work, uncheck the checkbox.
- Alternatively: enter any set via the "Sets" tab and uncheck the checkboxes for the target works.
How to delete or rename a set:
- Go to the "Sets" tab (next to the "Works" tab).
- Hover your mouse cursor over the set thumbnail and click the pencil icon.
- Make changes and click "Save" or select "Delete set".
Deleting a set is irreversible. The works themselves do not disappear from the interface, but if you delete a set by mistake, you will have to recreate it.
Payment plans
Currently, M+ Analytics offers two payment plans: Free and Beta. There are no packages available for the service.
Free
The plan includes data for all works and all microstock agencies, but only for the last 3 days. 1 set is included.
Beta
The plan includes data for all works and all microstock agencies for any time period (from one year to the most recent day). 200 sets are included.
The Free plan is a great way to explore the service and get familiar with its features, while the Beta plan is designed to be your ultimate work companion and a reliable guide for creating content that drives sales.
Begin your journey with M+ Analytics today! Simply click the [| link] and keep all your sales data conveniently accessible within a single, unified ecosystem.