Работа с MicroStock+Trends/en: различия между версиями
(Новая страница: «center<br clear=all>») |
(Новая страница: «===Pro=== Provides access to all files uploaded more than six months ago and all content in the tops starting from the #5 position») |
||
| Строка 65: | Строка 65: | ||
'''<span style="color: red;> Please note that if you have the “category” sorting mode active the last option will not be available!</span>''' | '''<span style="color: red;> Please note that if you have the “category” sorting mode active the last option will not be available!</span>''' | ||
| − | + | [[File:Top legend eng.jpg|center]]<br clear=all> | |
===What do numbers and icons on the thumbnails in the “Explore tops” section mean?=== | ===What do numbers and icons on the thumbnails in the “Explore tops” section mean?=== | ||
Версия 08:54, 11 февраля 2021
Содержание
What’s Microstock+ Trends?
Microstock+ Trends is a service that determines the market trends by analyzing the information gathered from one of the biggest microstock agencies — Shutterstock.
How can I benefit from it?
With M+ Trends you can easily track fresh content that’s quickly heading to the top. Using this information you can make similar content just in time to get into the trend and earn great sales. There are many search, filtering and sorting options that allow you to fine-tune the displayed results and get a full content coverage. In addition, every M+ Trends user receives a trend indicator that’s integrated into the M+ interface. This indicator allows you to predict popularity and sales of your files.
How does Microstock+ Trends work?
M+ Trends continuously monitors Shutterstock search results for every type of content (video, photo, vectors and illustrations). Each time a file changes its position, M+ Trends stores this information in its database. After that it’s using it to build the file position graph and determine its “trendiness”.
Trend indicator
Every M+ Trends subscription plan includes the trend indicator feature. This indicator is integrated into the M+ interface and once you purchase any M+ Trends subscription you should notice colored flame icons with numbers in the top right corner of your files’ thumbnails. Those numbers reflect the file’s “trendiness” in the 0-100 range (with 0 being the least trendy and 100 being the most trendy files).
Vibrant red color and high rating mean the file is very attractive and has a great selling potential. A picture above illustrates color gradation of trend indicator.
Language and subscription settings
You can choose the interface language (English or Russian) and check your subscription plan in the top right corner. Clicking on the current language lets you to select another one. And if you click on the subscription plan you will be redirected into the Services management dashboard where you can change it.
Stock Files section
“Stock Files” section is located in the top left corner. In this section you can explore trending categories and keywords. You can also view the sales graph of each file that’s built based on our neural network if your current subscription plan includes it (feature is still in development at the moment). We do NOT use the user’s sales data from the agency, we value your privacy and security.
How to work with the “Stock Files” section?
- Open the “Stock files” section using the corresponding icon in the top left corner.
- Click on the “Type” drop-down list and choose the content type you would like to explore.
- Next field is used for the global search mode, while the drop-down list “Search” below is used to fine-tune the search options like looking for a files by a specific author or of a certain age.
- Content is sorted by the M+ rating (read below) by default. You can use the “Sort” drop-down list to choose another sorting order.
What do those numbers and icons on the thumbnails in “Stock files” section mean?
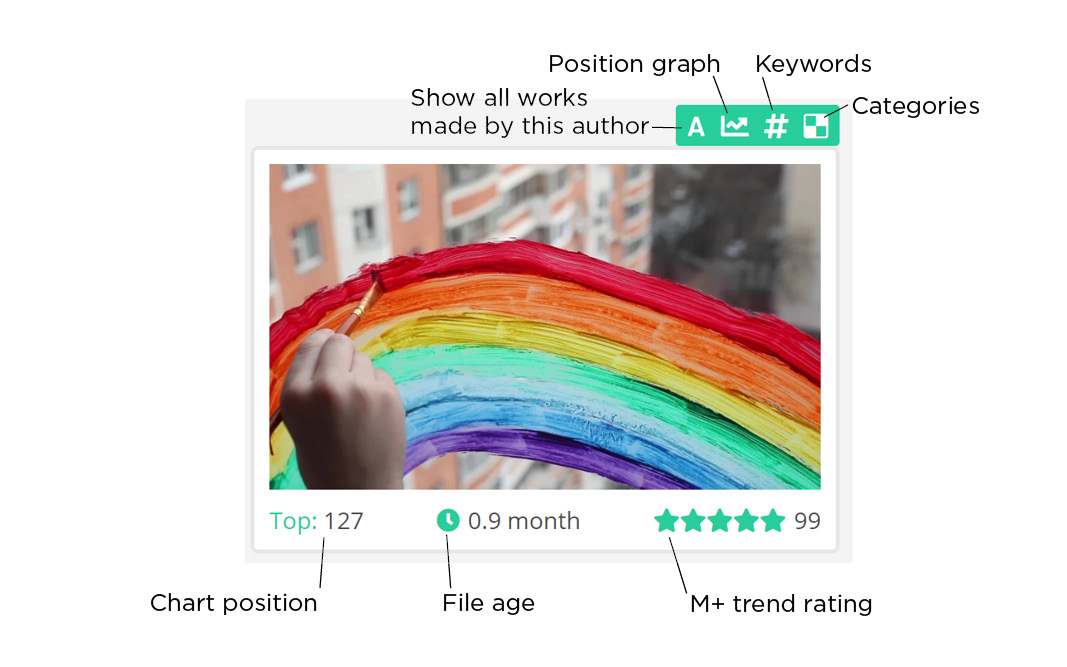
There will be a green controls panel when you hover a file thumbnail with your mouse. It’s always visible on mobile devices. You can click the corresponding buttons to view the categories and keywords of this file. Clicking it again will hide it. You can select and copy the categories/keywords like any other text on a web page (Ctrl/Cmd+C on a computer, pop-up menu on mobile devices). Clicking the thumbnail itself will open the original file on Shutterstock. There will also be an icon opening the calculated file sales graph if your subscription plan includes it (this feature is still in development). Bottom panel contains information about the file’s position in the global Shutterstock database, age since it’s been approved and it’s M+ rating in stars and as a numeric value. The more the rating the more trendy the file is.
What does the M+ rating show?
The M+ rating reflects the growth rate of a file in the Shutterstock database. Higher M+ rating means the file is quite young and has a great selling potential. Any file that reaches the top 10 page in the search results or higher within its first month on sale will most likely be really successful. According to the statistics, such files get to the top 1 page within a year. During that time it will still have great sales but you won’t be able to see it unless you look through 10 or more pages of the search results. M+ Trends service allows you to find such files with ease.
Explore Tops section
“Explore Tops” section icon is located in the top left corner under the “Stock Files” one. In this section you can trace the most popular keywords and categories and see what files contain them.
- Open the “Explore Tops” section by clicking the icon with a chart.
- Use the “Type” drop-down list to select the desired content type (video, photo, vector, illustrations).
- Files will be sorted by keywords by default, you can change it in the “Top For” drop-down list.
- “Category” drop-down list allows you to choose a specific category that you are interested in. By default M+ Trends displays files in all categories.
Please note that if you have the “category” sorting mode active the last option will not be available!
What do numbers and icons on the thumbnails in the “Explore tops” section mean?
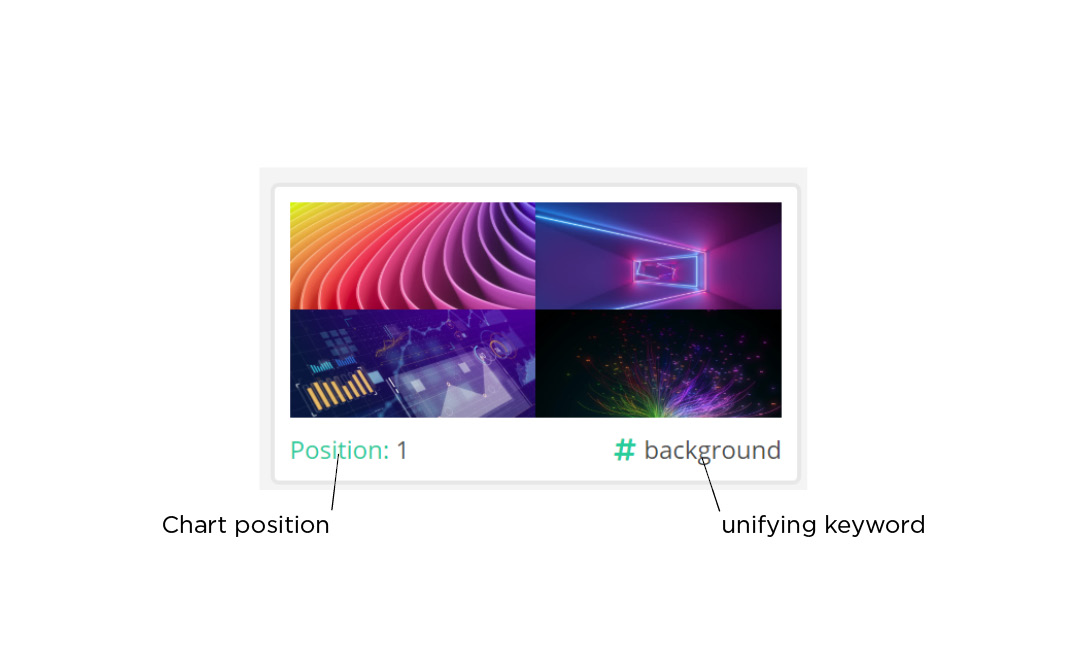
Once you get the right search options it’s time to analyze the search results. There should be a number of thumbnails to the right depending on your search options. A picture below is an example of a video file thumbnail with a legend. “Tops for” is set to “by tags”.
Unlike the “Stock Files” section, thumbnails in the “Explore Tops” section have no controls panel and each thumbnail contains four smaller thumbnails grouped by a unifying parameter (in this case it’s a keyword all these files have). Сlick on the thumbnail to open a collection of all content matching this parameter in the “Stock Files” section. A unifying parameter may be a category (all files belonging to the same popular category), author (all content made by the same author), etc.
Microstock+ Trends subscription plans
This service has a monthly subscription payment model. You can find more details in the MicroStock+ Trends section of our Services management dashboard. To open the Services management dashboard please click your current subscription plan in the top right corner. Every subscription plan includes the integrated trending indicator. There are three subscription plans at the moment:
Novice
Provides access to all files submitted more than a year ago and all content in the tops starting from the #20 position. This is a budget subscription plan, a nice way to become familiar with the service.
Pro
Provides access to all files uploaded more than six months ago and all content in the tops starting from the #5 position
Guru
Provides unlimited access to the database. This plan is the only one that has access to the sales graphs (this feature is still in development). It is the most efficient plan in our range because trending files can show their potential within their first 1-3 months on sale. It means the earlier you see the trend the easier it’s for you to be one of the first getting into the niche and to gain the biggest advantage.


