Работа с MicroStock+Analytics/en: различия между версиями
(Новая страница: «<gallery widths=550px heights=300px perrow=7> File:Gallery analytics.png|center|frame|Gallery </gallery>») |
(Новая страница: «Double‑click any card to open full statistics in a new browser tab. There you'll find a personal sales graph, its settings, a thumbnail, the title, content type...») |
||
| Строка 89: | Строка 89: | ||
</gallery> | </gallery> | ||
| − | + | Double‑click any card to open full statistics in a new browser tab. There you'll find a personal sales graph, its settings, a thumbnail, the title, content type, and links to the microstock agency pages where the work is being sold. | |
| − | |||
| − | |||
<div lang="ru" dir="ltr" class="mw-content-ltr"> | <div lang="ru" dir="ltr" class="mw-content-ltr"> | ||
Версия 17:35, 26 марта 2026
At a certain point, every stock contributor needs to analyze their portfolio to plan the next move. Which images are top performers? Which agencies bring the most value? M+ Analytics provides the data you need.
Содержание
What's M+Analytics
M+ Analytics is a companion service to M+ that allows you to track information about your portfolio's sales performance: the number of sales, profit in USD, and downloads. Its main feature is the sales graph, both overall and for individual stock agencies. For granular analysis, the platform allows you to organize files into custom "sets" (folders) for precise performance tracking.
The service aggregates real sales data directly from the agencies into a single dashboard, with the assurance that your information remains private.
This way, M+ Analytics allows you to evaluate your sales across all connected microstock agencies and helps define your strategic direction. Used alongside M+ Trends, it becomes a powerful tool for identifying profitable niches.
M+ Analytics uses the M+ database. All you need to get started is log in to your M+ account, navigate to the M+ Analytics (Free) page or purchase a subscription, and wait for the initial data to load (approximately within one hour). This article will introduce you to the service's interface, explain the sales graphs, and teach you how to create sets and populate them with your work.
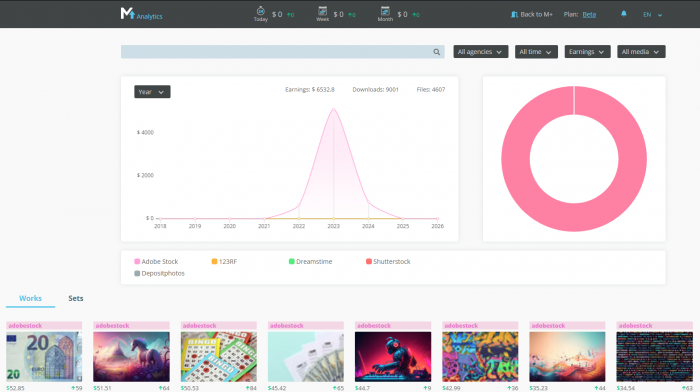
M+Analytics interface

For your convenience, let's break interface into three vertical sections:
- The top panel – contains your earnings counters and key service settings, such as language selection and notification preferences.
- The central area – your main analytical hub, featuring the sales graph, its control buttons, a search bar, a graph legend, and a pie chart.
- The bottom section – dedicated to the work gallery and sets.
Let's take a closer look at each of these areas.

Upper menu interface
- '''М+ Analytics logo''' – clicking the M+ Analytics logo with the left mouse button directs you to the starting page
- "Return to M+" button – directs you to the M+ interface and closes the M+ Analytics service. To return again, select "Analytics" from the left-hand menu within the M+ interface.
- '''Bell icon''' – notifications about new sales and their settings. Hover your mouse cursor over the icon to adjust the frequency. Notifications can be turned on or off in your browser settings.
- '''Language settings''' – the far-right icon. Currently, Russian and English are available.
- == 2. The central area. Graphs and graph settings ==
The central interface area

Search bar and filters
At the top of the center part, you'll find the search bar. Use it to locate files by name or description. Simply type your search term and press Enter or click the magnifying glass icon. The works in the lower part of the interface will be filtered, and the chart will adjust to reflect the selection.
Additional filters are located on the right:
- Agency selection – statistics for a specific stock or for all stocks combined.
- Period selection – displays data for the desired time range.
- When "Custom period" is selected, two buttons appear to the right of the dropdown menu showing the start and end of the period. Click the calendar icon to change the values.
- Earnings/Downloads – sorts the works and displays the chart either by works total earnings or by the number of downloads.
- Content type – the last filter lets you filter works by type: raster images (photos and illustrations), vectors, or video only.
How to work with the graph
The graph shows how downloads or earnings change over time, based on the filters you've chosen. The X‑axis represents time, and the Y‑axis represents earnings or downloads.
At the top‑left graph corner, you can set the aggregation period: year, month, two weeks, etc. This controls how much data is combined into each point on the graph line. In other words, the chart's granularity. This setting is automatically adjusted to match the time period you've selected in the filters.
Below the chart, you'll find color‑coded markers for each microstock agency. Clicking on a marker toggles whether that agency is included in the graph and the pie chart. The list of works in the results remains unchanged, making it easy to compare performance. Hover your cursor over any graph point to view the exact sales/download numbers for the selected microstock agency.
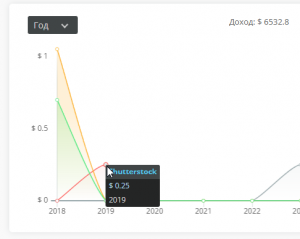
Graph point showing earnings

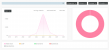
A pie chart
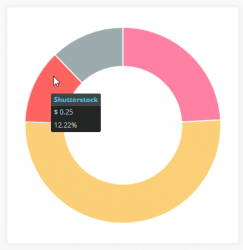
A pie chart and earnings for a specific microstock agency

A pie chart gives you a quick view of sales or downloads broken down by percentage. It automatically reflects the same filters you've set for the sales graph. The colors of the segments match the color‑coded markers for each microstock agency.
Simply hover your mouse cursor over a segment to see the exact number and its percentage share relative to the total of all selected microstock agencies.
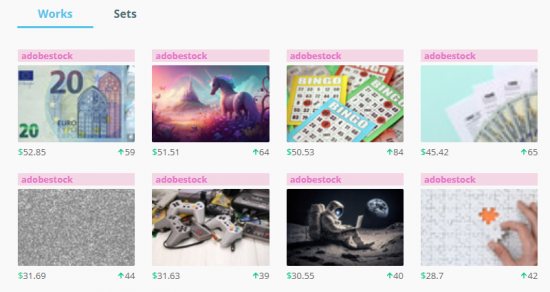
3. Bottom section: Works gallery and sets
At the bottom of the interface, you'll find a gallery of all works ever uploaded to stocks through M+. Each work appears as a preview card.
Gallery
Gallery

Double‑click any card to open full statistics in a new browser tab. There you'll find a personal sales graph, its settings, a thumbnail, the title, content type, and links to the microstock agency pages where the work is being sold.
Карточка-превью содержит базовую информацию: на каком стоке работа продаётся, сколько она заработала на нём (суммарно за указанный период), сколько было скачиваний за указанный период.
Чтобы увидеть больше работ в галерее, просто прокрутите страницу вниз.
Кнопка в правом нижнем углу быстро возвращает в начало страницы.
При наведении на любую карточку работы появляется возможность добавить её в сет. О сетах – ниже.
Сеты
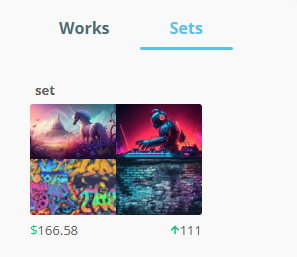
Пример сета

Сеты – это инструмент для организации работ в наборы. С их помощью можно просматривать статистику по каждой группе отдельно. Относитесь к сетам как к доскам в Pinterest или как к папкам на вашем ПК.
Как создать сет:
- Наведите курсор на любое превью.
- Кликните по всплывающей плашке.
- Выберите «+ Новый сет», введите название и нажмите Enter.
Как войти в сет:
- Перейдите во вкладку «Сеты»
- Кликните дважды по любому сету
Все работы, включённые в сет, будут отображены в виде превью. График и диаграмма также будут отображать данные выбранного сета.
Как добавить работу в сет:
- Наведите курсор на работу и отметьте чекбокс нужного сета. Чтобы удалить работу – снимите чекбокс.
- Альтернативно: зайдите в любой сет через вкладку «сеты» и снимите чекбоксы с целевых работ.
Как удалить или переименовать сет:
- Перейдите во вкладку «Сеты» (рядом с вкладкой «Работы»).
- Наведите курсор на превью сета и нажмите иконку карандаша.
- Внесите изменения и нажмите «Сохранить» или выберите «Удалить сет».
Удаление сета необратимо. Сами работы из интерфейса не пропадают, но если вы удалили сет по ошибке, собирать его придётся заново.
Тарифы
На данный момент у M+ Analytics есть два тарифа: бесплатный (Free) и платный (Beta). Пакетов у сервиса нет.
Free
В тариф включены данные по всем работам и всем стокам, но только за последние 3 дня. В тариф включён 1 сет.
Beta
В тариф включены данные по всем работам и всем стокам за любой временной период (от года до последнего дня). В тариф включено 200 сетов.
Бесплатный тариф отлично подходит для ознакомления с сервисом, тогда как платный станет идеальным помощником в вашей работе и компасом для создания продающегося контента.
Начните ваше путешествие с M+ Analytics сегодня! Просто перейдите по ссылке и держите все данные о продажах под рукой в одной экосистеме.